前端性能监控方案(首屏、白屏时间等)
Category(分类): Browser, Performance Status: 已更新
原文介绍了代码监控/工具监控、合成监控/RUM,以及白屏、首屏、DOMContentLoaded、
load和window.performance.timing。这些思路仍然有价值,但部分字段已经废弃,且“首屏时间”“可操作时间”“总下载时间”并不是浏览器统一定义的指标。本文保留原文的测量方法,同时补充 Performance Timeline、Core Web Vitals、SPA 路由、真实用户监控和数据治理。
一、为什么要做性能监控
性能优化不能只看开发者电脑上的 Lighthouse 分数。不同用户的设备、网络、地理位置、浏览器、登录状态和页面数据不同,实验室结果无法代表所有真实体验。
性能监控要回答三个问题:
- 用户什么时候看到内容、能与页面交互?
- 哪个阶段、哪类资源或哪段 JavaScript 造成了延迟?
- 发布新版本后,哪些页面、设备或地区变差了?
监控的目标不是收集越多字段越好,而是建立“指标 → 诊断数据 → 版本/用户群 → 优化动作”的闭环。
二、代码监控、工具监控、合成监控和 RUM
1. 代码监控与工具监控
以 web-vitals、Performance API 和自研上报为代表的代码监控运行在真实页面中,可以采集用户现场数据;WebPageTest、Lighthouse、DevTools Performance 等属于工具监控,适合在固定设备和网络条件下复现、对比和诊断。
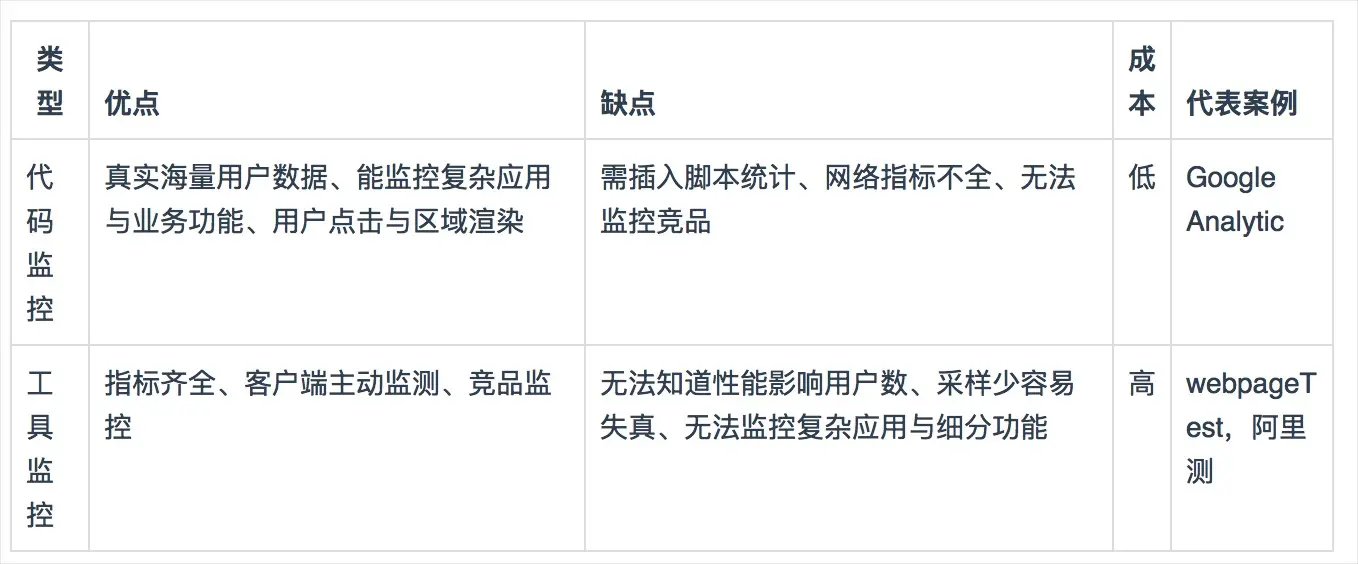
两者不是互相替代的关系:
- 工具监控可重复、可用于 CI 回归,但场景是模拟的;
- RUM 能看到真实用户体验和长尾问题,但受采样、浏览器支持和隐私策略影响;
- 最好用工具定位原因,用 RUM 验证上线后的真实收益。
2. Synthetic Monitoring 与 RUM
**合成监控(Synthetic Monitoring,SYN)**由固定脚本定期访问页面,可以监控可用性、关键流程和实验室性能。
**真实用户监控(Real User Monitoring,RUM)**在用户浏览器中采集导航、资源、交互和 Web Vitals,再按页面、版本、设备、网络和地区聚合。
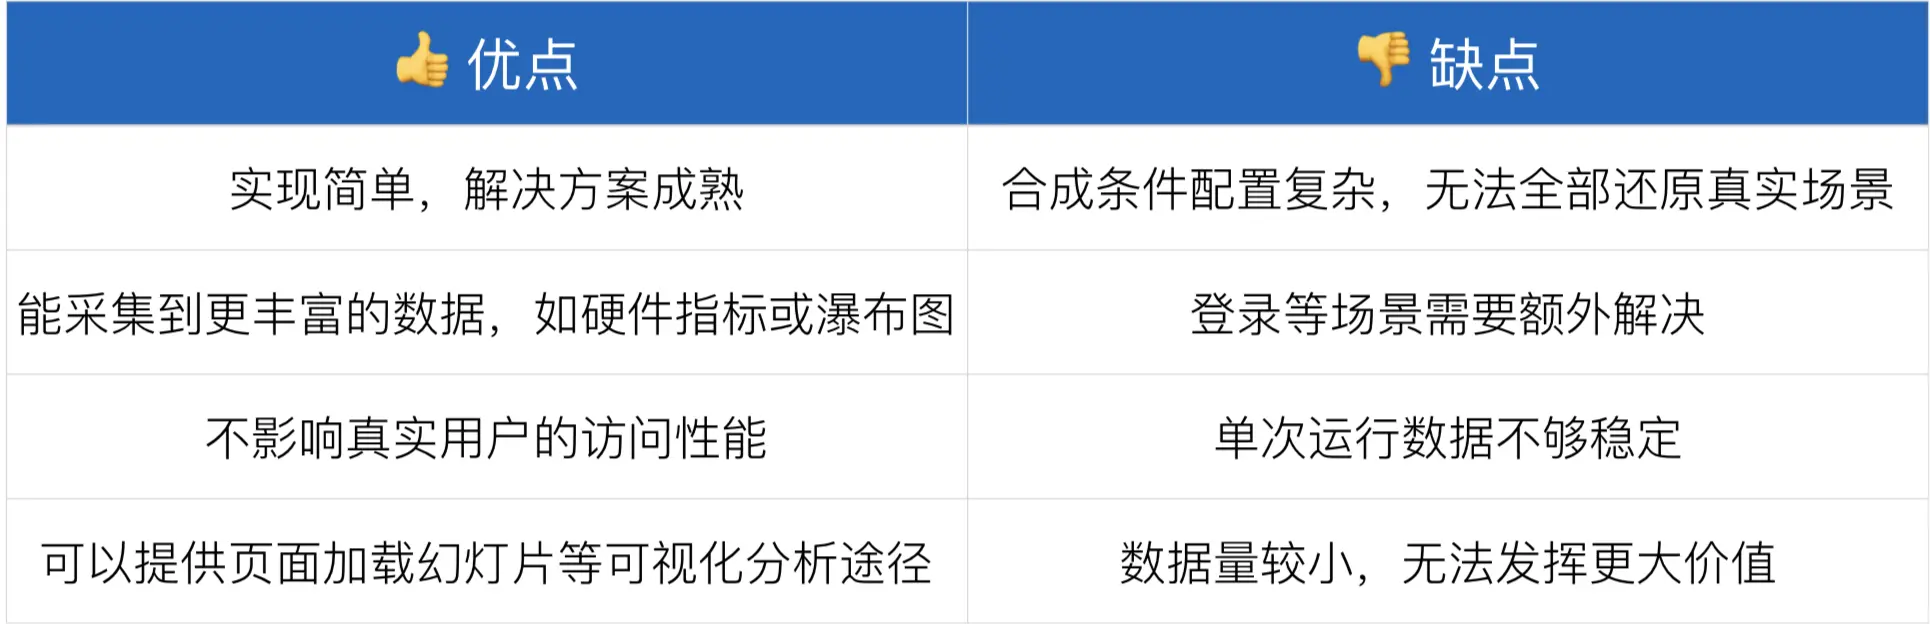
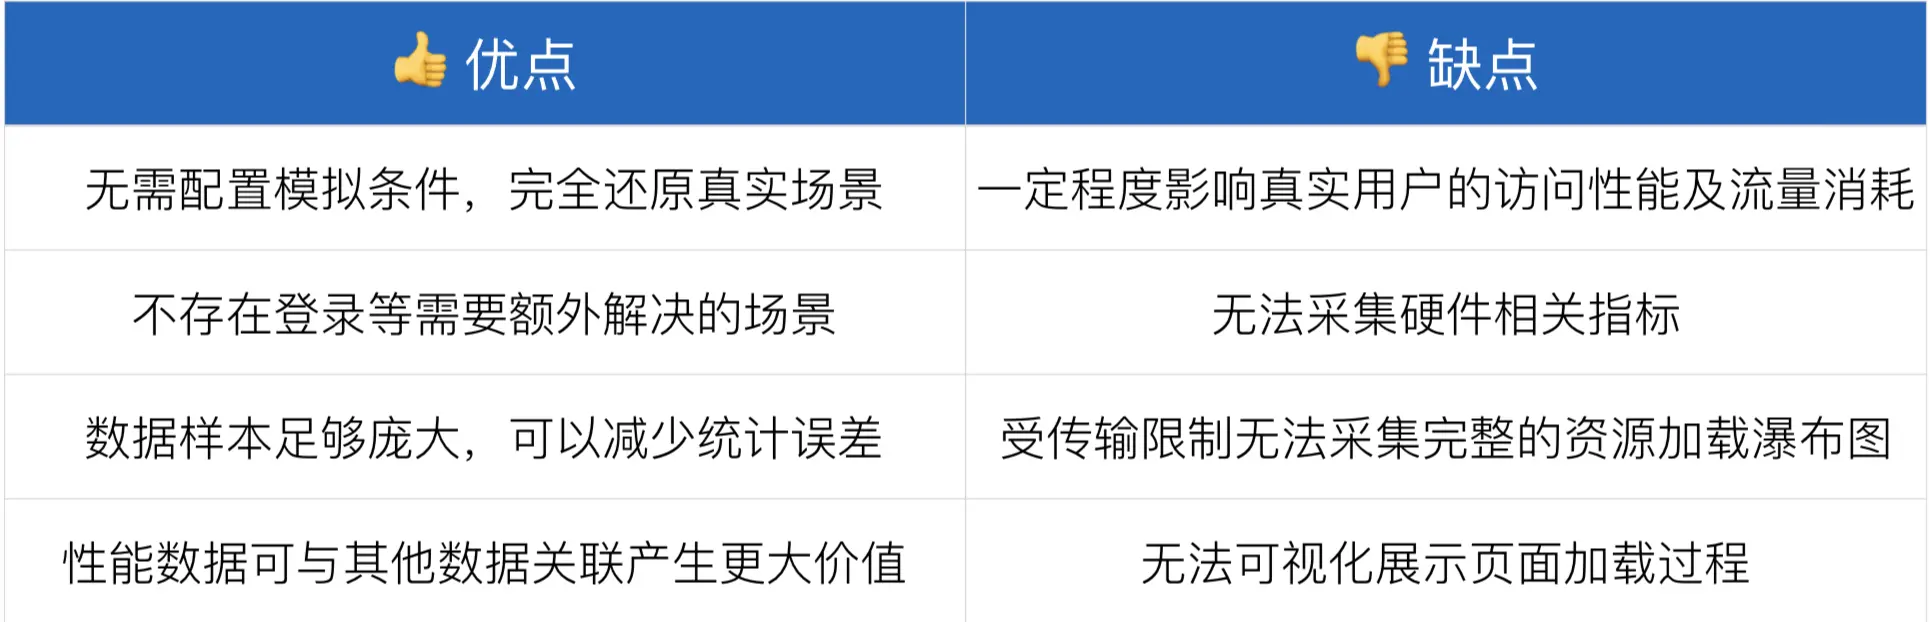
RUM 上报前应考虑:
- 采样率和批量上报,避免监控代码本身影响性能;
- 不采集密码、Cookie、完整 URL 中的敏感查询参数或用户输入;
- 对用户同意、隐私法规、数据保留周期和跨境传输做合规设计;
- 按页面、版本、设备类别、网络类型、地区和登录状态分组;
- 使用 p50、p75、p90/p95 等分位数,不只看平均数;
- 记录 SDK 版本、构建版本和实验分组,保证数据可回溯。
三、关键指标应该怎样理解
1. 白屏时间和 FCP
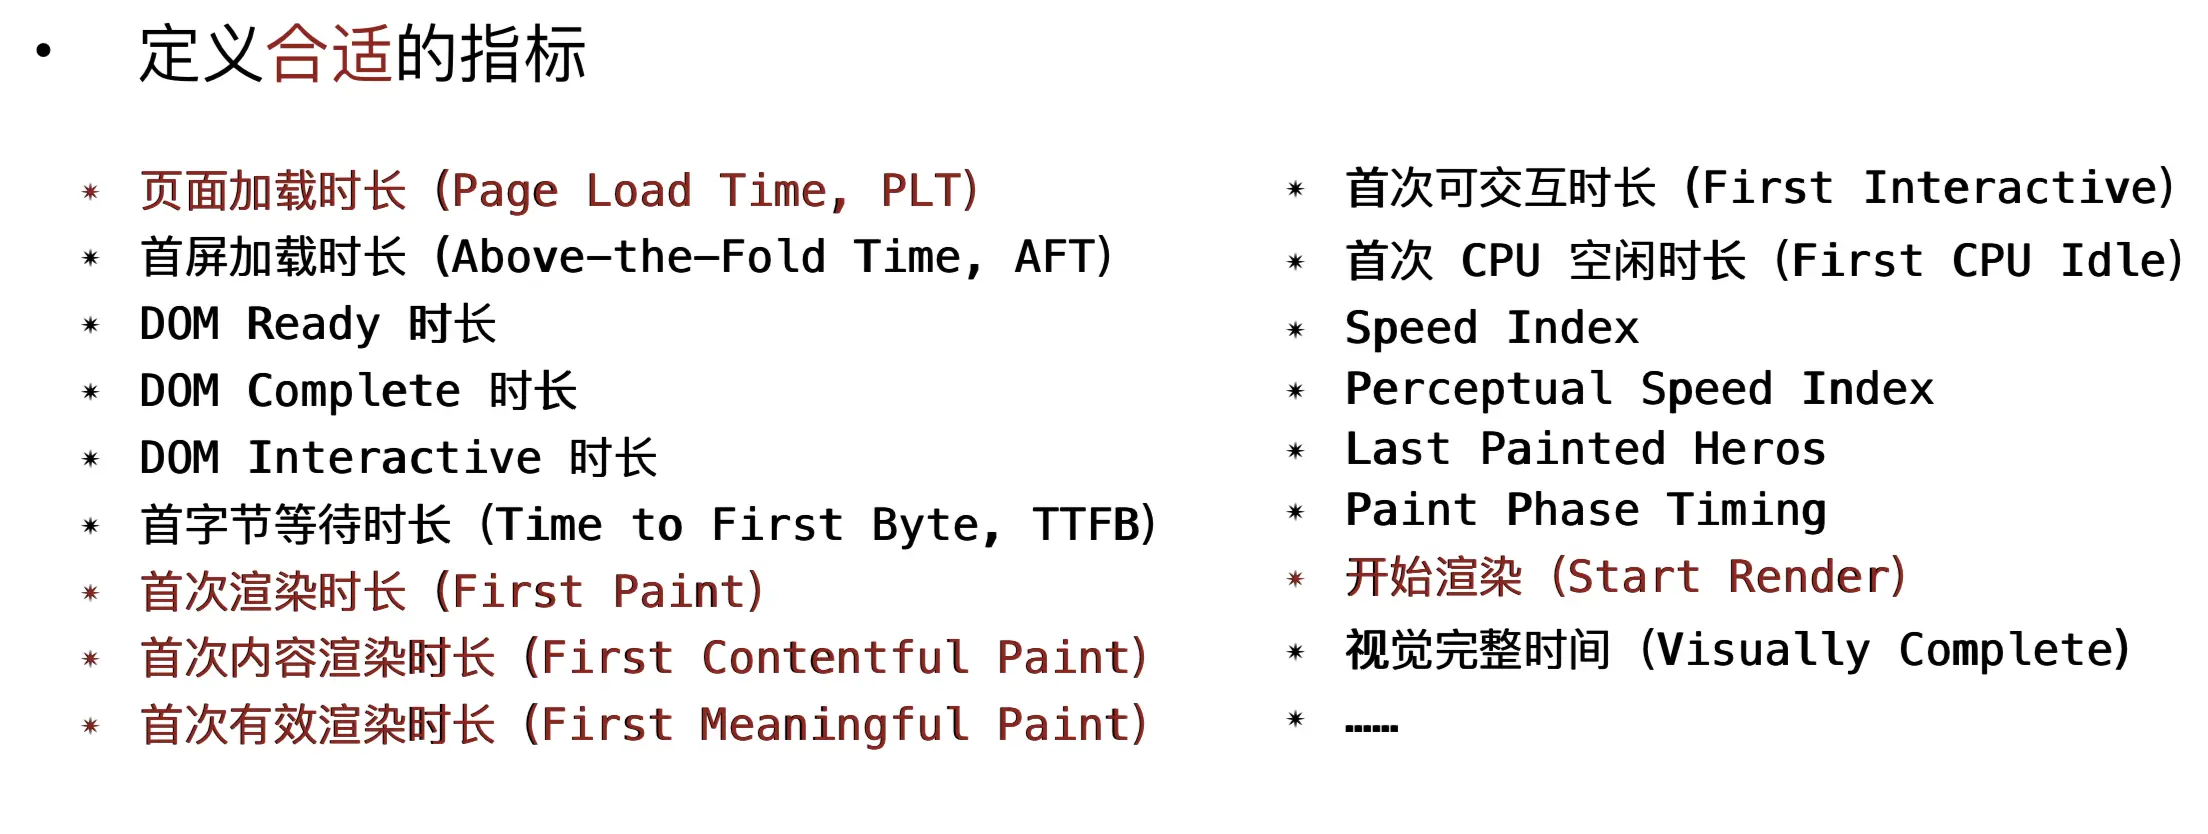
“白屏时间”是业务或监控团队对“用户进入页面后多久看到第一个有意义的像素/内容”的俗称,不是所有浏览器都提供的统一字段。原文把白屏时间简单等同于 firstPaint - pageStartTime,只能作为页面内的近似值,无法覆盖 HTML 文档开始加载之前的阶段。
更标准的指标是 FCP(First Contentful Paint):浏览器首次绘制来自 DOM 的文本、图片、非白色 canvas 等内容的时间。FCP 仍然不代表页面主要内容已经出现,应该和 LCP 一起分析。
FCP 的实验室“良好”参考阈值通常是 1.8 秒以内;实际监控要以目标用户群的 p75 为准,不能把一个阈值当成所有业务的硬性规则。
2. 首屏时间和 LCP
“首屏时间”取决于屏幕大小、内容布局、图片加载和业务定义,首屏元素数量不固定时,用“最后一张首屏图片 onload”很脆弱。响应式页面、字体替换、懒加载、轮播和动态接口都会让这种算法失真。
现代 Web 性能更推荐 LCP(Largest Contentful Paint):视口内最大的文本块、图片或视频海报等内容何时完成绘制。LCP 会随着候选元素变化,通常在用户交互、页面隐藏或加载结束时取最终候选值。
Core Web Vitals 当前主要包括:
| 指标 | 主要衡量 | p75 常用目标 |
|---|---|---|
| LCP | 加载阶段主要内容出现速度 | ≤ 2.5 秒 |
| INP | 用户交互到页面响应的延迟 | ≤ 200 毫秒 |
| CLS | 内容意外位移的稳定性 | ≤ 0.1 |
这些目标是“良好”参考线,应该按设备和业务场景观察分布。不要再把已经从 Lighthouse 核心指标中移除的 TTI 当作当前 Core Web Vital。
3. DOMContentLoaded、可交互和 load
DOMContentLoaded表示 HTML 解析完成且延迟脚本执行完成等条件满足;它不保证图片完成,也不保证用户操作不会被长任务阻塞;load等待文档依赖的资源完成,是历史上的完整加载节点,但不等于用户已经感觉页面可用;- “可操作时间”不是单独等于 DOM ready。页面可能已经触发 DCL,但主线程仍被长任务占用;INP 和 Long Tasks 更适合观察交互响应;
- 对 SPA 路由切换,文档导航事件不会重新触发,应该使用自定义 mark/measure 或框架路由钩子。
四、白屏、首屏的实现方式和局限
1. 原文的 HTML 标记法
把页面开始时间写入 <head>,在某个位置记录结束时间,是一种简单的业务近似:
<!doctype html>
<html lang="zh-CN">
  <head>
    <meta charset="UTF-8">
    <title>白屏时间示例</title>
    <script>
      window.pageStartTime = performance.now()
    </script>
    <link rel="stylesheet" href="/assets/app.css">
    <script>
      window.headParsedTime = performance.now()
    </script>
  </head>
  <body>
    <main>页面内容</main>
  </body>
</html>
headParsedTime - pageStartTime 不是 FCP,也不是从用户输入 URL 开始的完整白屏时间。更可靠的做法是使用 Paint Timing,并在首屏阶段记录 LCP:
const paintEntries = performance.getEntriesByType('paint')
const firstPaint = paintEntries.find(entry => entry.name === 'first-paint')
const firstContentfulPaint = paintEntries.find(
  entry => entry.name === 'first-contentful-paint'
)

console.log({
  firstPaint: firstPaint?.startTime,
  firstContentfulPaint: firstContentfulPaint?.startTime
})
Paint Timing 和 LCP 都可能在页面加载后才产生,应该在页面隐藏或合适的生命周期上报,而不是只在同步脚本中读取一次。
2. 首屏模块标记法
业务可以定义“关键模块已经可见”的时间:
<section id="hero">首屏核心内容</section>
<script>
  performance.mark('hero-visible-marker')
</script>
更推荐在模块真正渲染并满足业务条件后调用 performance.mark(),而不是把脚本简单插在某个 DOM 节点后面。需要明确这个指标的定义,例如:核心标题、价格、主图和主操作按钮都可见。
3. 图片 onload 法
原文通过首屏图片 onload 计算首屏时间,可以保留为固定布局的历史方案,但应改为本地或稳定资源,并处理图片失败、缓存命中和图片不是最大内容等情况:
<img src="/assets/hero.webp" alt="产品主视觉" data-above-fold>
<img src="/assets/logo.webp" alt="产品标志" data-above-fold>
<script>
  const aboveFoldImages = [...document.querySelectorAll('img[data-above-fold]')]
  let loaded = 0
  const startedAt = performance.now()

  const markReady = () => {
    loaded += 1
    if (loaded === aboveFoldImages.length) {
      console.log('above-fold-images', performance.now() - startedAt)
    }
  }

  for (const image of aboveFoldImages) {
    if (image.complete) markReady()
    else {
      image.addEventListener('load', markReady, { once: true })
      image.addEventListener('error', markReady, { once: true })
    }
  }
</script>
示例中的 performance.measure() 只是说明概念;如果没有名为 navigationStart 的 mark,不要直接这样调用。实际项目可以保存 performance.timeOrigin 或使用 Navigation Timing 入口计算。首屏时间最终应由业务、设计和监控团队共同定义。
五、Navigation Timing:替代废弃的 performance.timing
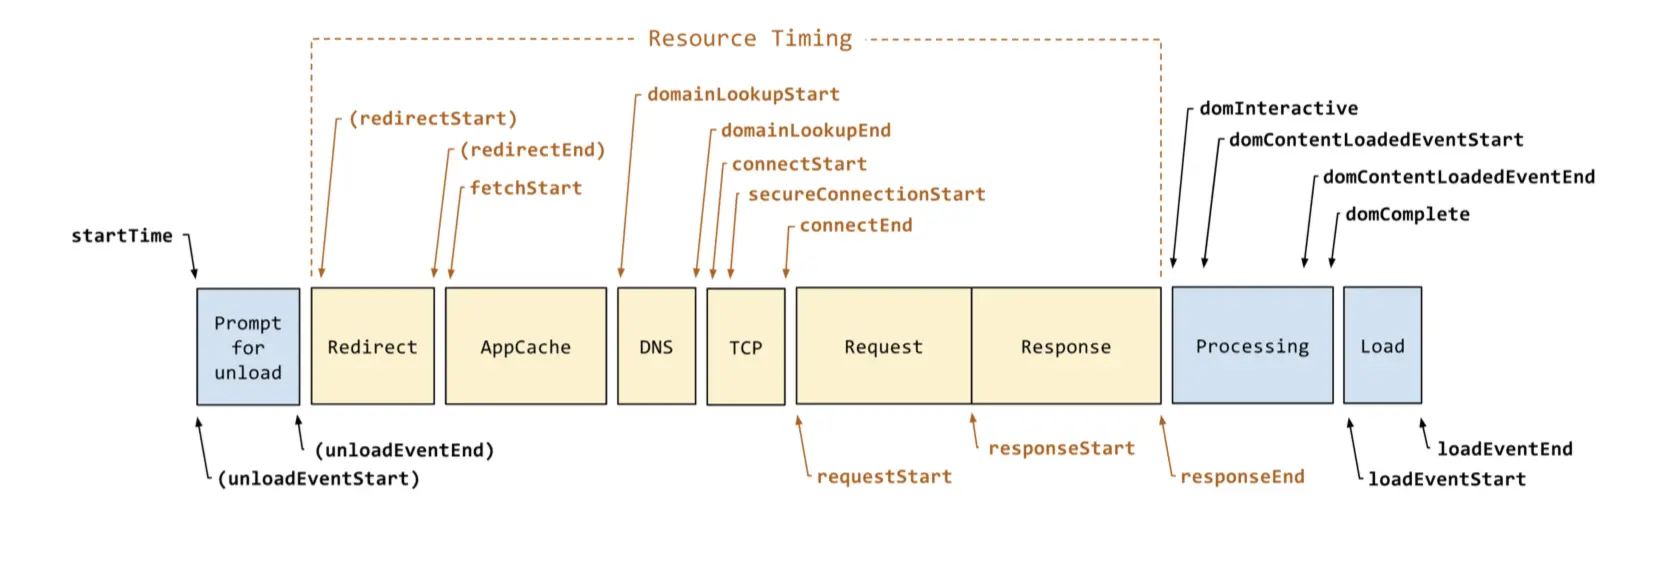
原文大量使用 window.performance.timing、navigationStart 和 performance.navigation。这些旧接口已经被标记为 deprecated,现代代码应使用:
const navigation = performance.getEntriesByType('navigation')[0]

if (navigation) {
  console.table({
    type: navigation.type,
    redirect: navigation.redirectEnd - navigation.redirectStart,
    dns: navigation.domainLookupEnd - navigation.domainLookupStart,
    tcp: navigation.connectEnd - navigation.connectStart,
    tls: navigation.secureConnectionStart
      ? navigation.connectEnd - navigation.secureConnectionStart
      : 0,
    request: navigation.responseStart - navigation.requestStart,
    response: navigation.responseEnd - navigation.responseStart,
    domInteractive: navigation.domInteractive,
    domContentLoaded: navigation.domContentLoadedEventEnd,
    load: navigation.loadEventEnd
  })
}
PerformanceNavigationTiming 的时间通常相对于 performance.timeOrigin,文档导航入口的 startTime 通常为 0。常见计算包括:
DNS 耗时       = domainLookupEnd - domainLookupStart
TCP 耗时       = connectEnd - connectStart
TLS 耗时       = connectEnd - secureConnectionStart(存在时)
请求等待       = responseStart - requestStart
响应传输       = responseEnd - responseStart
DOM 交互       = domInteractive
DCL            = domContentLoadedEventEnd
load           = loadEventEnd
需要注意:
- 复用连接、缓存、Service Worker 和预连接可能让某些阶段为 0 或没有独立网络耗时;
responseStart/responseEnd也可能对应缓存或本地响应,不要绝对解释为“服务器开始/结束发送”;DOMContentLoaded不代表图片全部完成,也不等于页面可以流畅交互;loadEventEnd可能受非关键资源影响,不能作为唯一体验指标;navigation.type使用navigate、reload、back_forward等字符串枚举,不应继续使用旧的数字常量;- 重定向和跨源资源的详细计时会受到浏览器隐私和 Timing-Allow-Origin 等规则限制。
六、Paint、LCP、CLS 和 INP
1. 监听 FCP 和 LCP
function observePaintMetrics() {
  if (!('PerformanceObserver' in window)) return

  const paintObserver = new PerformanceObserver(list => {
    for (const entry of list.getEntries()) {
      if (
        entry.name === 'first-contentful-paint' ||
        entry.name === 'first-paint'
      ) {
        console.log(entry.name, entry.startTime)
      }
    }
  })
  paintObserver.observe({ type: 'paint', buffered: true })

  let lastLcp
  const lcpObserver = new PerformanceObserver(list => {
    const entries = list.getEntries()
    lastLcp = entries.at(-1)
  })
  lcpObserver.observe({ type: 'largest-contentful-paint', buffered: true })

  const reportLcp = () => {
    if (!lastLcp) return
    console.log({
      lcp: lastLcp.startTime,
      element: lastLcp.element?.tagName,
      url: lastLcp.url
    })
    lcpObserver.disconnect()
  }

  document.addEventListener('visibilitychange', () => {
    if (document.visibilityState === 'hidden') reportLcp()
  }, { once: true })
}

observePaintMetrics()
LCP 不是页面加载后只产生一次的固定事件:候选元素可能变化,用户交互、页面隐藏或导航结束时应停止观察并上报最后的候选值。不要把图片 URL、文本内容等未经处理的数据直接发送到监控平台。
2. CLS
CLS 通过 layout-shift 条目累积没有用户输入导致的布局位移:
let clsValue = 0
let clsSessionValue = 0
let sessionStart = 0
let lastShiftTime = 0

const clsObserver = new PerformanceObserver(list => {
  for (const entry of list.getEntries()) {
    if (entry.hadRecentInput) continue

    const gap = entry.startTime - lastShiftTime
    if (sessionStart && (gap > 1000 || entry.startTime - sessionStart > 5000)) {
      clsSessionValue = 0
      sessionStart = entry.startTime
    }

    if (!sessionStart) sessionStart = entry.startTime
    clsSessionValue += entry.value
    clsValue = Math.max(clsValue, clsSessionValue)
    lastShiftTime = entry.startTime
  }
})

clsObserver.observe({ type: 'layout-shift', buffered: true })
生产环境建议使用 web-vitals 库获取经过兼容性处理和归因的指标,而不是自行复制完整算法:
import { onCLS, onINP, onLCP } from 'web-vitals'

const report = metric => {
  navigator.sendBeacon(
    '/rum',
    new Blob([JSON.stringify({
      name: metric.name,
      value: metric.value,
      id: metric.id,
      rating: metric.rating
    })], { type: 'application/json' })
  )
}

onCLS(report)
onINP(report)
onLCP(report)
3. INP 和长任务
INP 衡量用户与页面交互后,浏览器呈现下一次视觉更新前的延迟,覆盖点击、键盘和指针等交互。它不是简单的 click 事件耗时,也不能只测一个按钮。
可以用 event PerformanceEntry 做诊断,但不要把所有事件的 duration 直接当成 INP:
if ('PerformanceObserver' in window) {
  const eventObserver = new PerformanceObserver(list => {
    for (const entry of list.getEntries()) {
      if (entry.interactionId) {
        console.log('interaction diagnostic', {
          name: entry.name,
          duration: entry.duration,
          interactionId: entry.interactionId,
          processingStart: entry.processingStart,
          processingEnd: entry.processingEnd,
          presentationTime: entry.startTime + entry.duration
        })
      }
    }
  })

  eventObserver.observe({ type: 'event', buffered: true, durationThreshold: 16 })
}
长任务通常指主线程连续执行超过 50ms 的任务,会延迟输入和渲染:
const longTaskObserver = new PerformanceObserver(list => {
  for (const entry of list.getEntries()) {
    console.log('long task', {
      duration: entry.duration,
      startTime: entry.startTime,
      attribution: entry.attribution
    })
  }
})

longTaskObserver.observe({ type: 'longtask', buffered: true })
诊断方向包括拆分 JavaScript、减少同步计算、避免长时间布局读写、延迟第三方脚本,以及把非 UI 计算放到合适的 Worker 中。
七、资源加载监控
原文使用 widow.performance.getEntries(),正确写法是 window.performance.getEntries()。现代代码可以使用 Resource Timing:
const resources = performance.getEntriesByType('resource')

for (const resource of resources) {
  console.table({
    name: resource.name,
    initiatorType: resource.initiatorType,
    duration: resource.duration,
    dns: resource.domainLookupEnd - resource.domainLookupStart,
    tcp: resource.connectEnd - resource.connectStart,
    ttfb: resource.responseStart - resource.requestStart,
    transferSize: resource.transferSize,
    encodedBodySize: resource.encodedBodySize,
    decodedBodySize: resource.decodedBodySize
  })
}
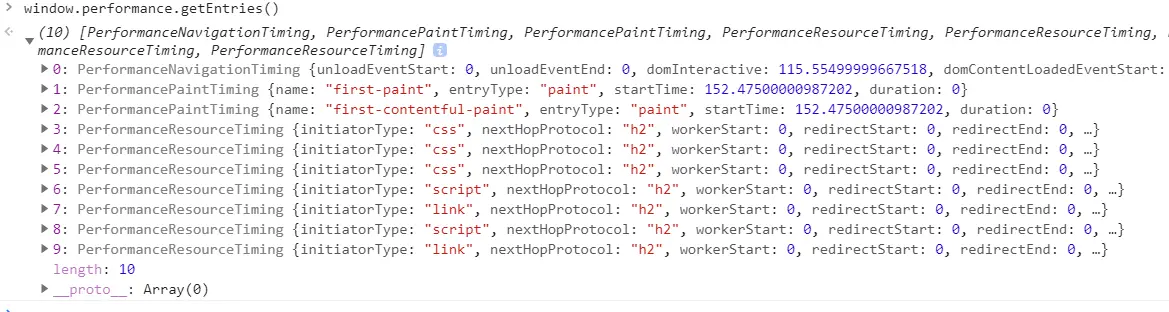
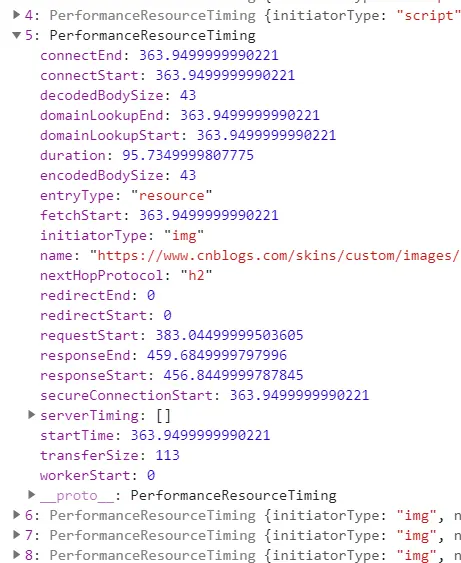
transferSize 为 0 可能表示命中缓存、Service Worker 或跨源计时受限,不等于资源没有被使用。跨源资源要获得完整 Resource Timing,服务端通常需要配置 Timing-Allow-Origin。
initiatorType 常见值包括 img、script、link、css、fetch 等;不同浏览器对类型和细节支持存在差异。不要把 Resource Timing 当作服务器日志的替代品,它更适合和请求 URL、构建版本、服务端 Server-Timing 一起分析。
Server-Timing
后端可以通过响应头把数据库、模板和缓存耗时传给浏览器:
Server-Timing: db;dur=12, template;dur=4, cache;desc="HIT"
前端可以读取:
const navigation = performance.getEntriesByType('navigation')[0]
for (const metric of navigation?.serverTiming ?? []) {
  console.log(metric.name, metric.duration, metric.description)
}
八、内存、错误和网络质量
1. 内存
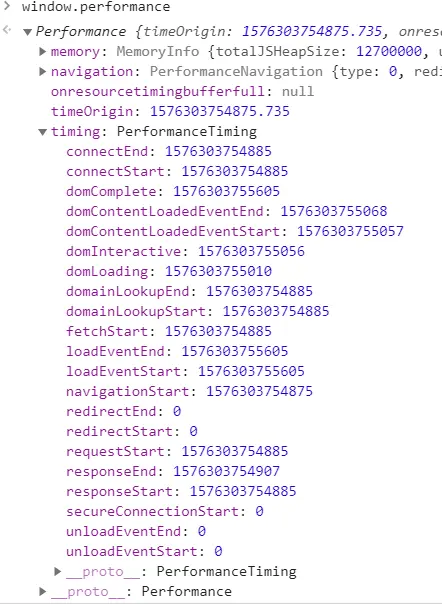
原文中的 performance.memory 只在部分 Chromium 环境存在,不是跨浏览器稳定的通用指标,也不适合作为所有用户的“JavaScript 内存占用”基线。可以在支持时作为诊断字段,但不要据此比较所有浏览器:
const memory = performance.memory

if (memory) {
  console.log({
    used: memory.usedJSHeapSize,
    total: memory.totalJSHeapSize,
    limit: memory.jsHeapSizeLimit
  })
}
更可靠的内存问题诊断通常需要 DevTools Heap Snapshot、浏览器任务管理器、崩溃/页面冻结数据和针对特定浏览器的实验。
2. JavaScript 和资源错误
window.addEventListener('error', event => {
  const target = event.target
  if (target instanceof HTMLScriptElement || target instanceof HTMLImageElement) {
    report({
      type: 'resource-error',
      url: target.src || target.href
    })
  } else {
    report({
      type: 'runtime-error',
      message: event.message,
      source: event.filename,
      line: event.lineno,
      column: event.colno
    })
  }
}, true)

window.addEventListener('unhandledrejection', event => {
  report({ type: 'unhandled-rejection', reason: String(event.reason) })
})
错误上报同样要脱敏、限流和采样。不要把完整用户输入、访问令牌和敏感 URL 放进日志。
3. 网络信息
navigator.connection 在部分浏览器中提供网络类型和估算带宽,可以作为分组维度,但不能当作精确测速结果。真实性能还受到 RTT、拥塞、代理、设备 CPU、电量和服务端负载影响。
九、SPA 路由性能
Navigation Timing 只描述文档导航。Vue、React 等 SPA 切换路由时,应在路由钩子和关键内容渲染完成处自定义测量:
router.beforeEach(() => {
  performance.mark('route-start')
})

router.afterEach(async to => {
  await nextTick()
  await new Promise(requestAnimationFrame)

  performance.mark('route-content-ready')
  performance.measure(
    `route:${to.name}`,
    'route-start',
    'route-content-ready'
  )

  const measure = performance.getEntriesByName(`route:${to.name}`).at(-1)
  report({
    type: 'spa-route',
    route: String(to.name),
    duration: measure?.duration
  })
})
上面的示例是业务指标,不是 LCP。真实项目应避免在每次路由切换后无限积累 mark/measure,可在读取后 clearMarks/clearMeasures,也要处理数据加载失败和取消导航。
十、实验室和线上数据如何结合
实验室监控适合
- 固定设备、浏览器、CPU 限制和网络配置;
- 对比提交前后的资源大小、LCP、脚本执行和长任务;
- 发现渲染阻塞资源、未压缩资源、布局抖动和第三方脚本问题;
- 在 CI 中设置预算,例如 JavaScript 总大小、关键请求数和 LCP 上限。
RUM 适合
- 观察不同设备、网络、地区和版本的 p75/p95;
- 发现实验室未覆盖的低端设备、运营商和真实交互问题;
- 判断发布、A/B 实验或 CDN 变更是否影响用户;
- 把性能与转化、留存、错误率等业务结果关联。
两种数据不应直接混为一个分数:实验室是可重复的控制变量,RUM 是真实世界的分布。监控平台至少应保留页面 URL(脱敏)、构建版本、时间、设备类别、网络类型、指标值和采样信息。
十一、上报设计示例
function report(payload) {
  const body = JSON.stringify({
    ...payload,
    page: location.pathname,
    build: window.__BUILD_ID__,
    timeOrigin: performance.timeOrigin,
    viewport: `${innerWidth}x${innerHeight}`
  })

  if (navigator.sendBeacon) {
    navigator.sendBeacon(
      '/rum',
      new Blob([body], { type: 'application/json' })
    )
    return
  }

  fetch('/rum', {
    method: 'POST',
    body,
    headers: { 'Content-Type': 'application/json' },
    credentials: 'same-origin',
    keepalive: true
  }).catch(() => {})
}
上报接口应设置采样、大小限制、鉴权或防滥用策略,并且不能因为监控失败影响主业务。通常在页面隐藏时集中上报:
document.addEventListener('visibilitychange', () => {
  if (document.visibilityState === 'hidden') {
    report({ type: 'page-hidden' })
  }
}, { once: true })
十二、从原文到现代实践的修正
window.performance.timing、performance.navigation已过时,使用 Navigation Timing Level 2;window.performance.getEntries()没有拼写错误,资源监控可用getEntriesByType('resource');DOMContentLoaded不等于用户可以流畅操作,load也不等于用户体验完成;firstPaint和手动 HTML 标记是近似值,不应直接称作标准白屏时间;- “首屏时间 = 最慢图片 onload”只适合固定布局的业务近似,不适合所有响应式页面;
- 当前重点应关注 LCP、INP、CLS,同时结合 FCP、长任务、资源 Timing 和错误数据;
performance.memory不是跨浏览器通用内存指标;- 监控数据要用分位数和版本/设备/网络维度分析,不能只看平均值;
- RUM、合成监控、Lighthouse 和 WebPageTest 解决不同问题,应组合使用。
总结
- 性能监控要同时覆盖实验室数据和真实用户数据;
- 白屏、首屏、可操作时间可以作为业务指标,但要写清定义和测量边界;
- LCP、INP、CLS 是当前核心体验指标,FCP、长任务和 Resource Timing 用于补充诊断;
- 用 PerformanceObserver 观察 Paint、LCP、CLS、交互和长任务;
- 用 PerformanceNavigationTiming 替代废弃的
performance.timing; - SPA 路由需要自定义 mark/measure,文档导航指标不会自动覆盖路由切换;
- 上报要考虑采样、聚合、隐私、脱敏、版本和数据成本;
- 指标发现问题后,还要结合资源、代码、服务端和设备信息定位根因。
参考资料
- MDN:Performance API
- MDN:PerformanceNavigationTiming
- MDN:PerformanceObserver
- MDN:LargestContentfulPaint
- MDN:PerformanceEventTiming
- MDN:LayoutShift
- MDN:Resource Timing
- MDN:Server Timing
- web.dev:Web Vitals
- web.dev:Getting started with measuring Web Vitals
- web.dev:Best practices for measuring Web Vitals in the field
- web-vitals GitHub